# Elastic stack 環境建置(docker compose)
此篇用 docker compose 搭建 Elastic stack ,達到一鍵啟動 Elastic stack 單節點環境的效果,需要達到的目標如下
- 編寫專用的 docker compose yml 啟動服務
- 將 Elastic stack 各項服務資料持久化到硬碟上
- 將 Elastic stack 各項 Config 暴露到實體路徑
- 詳細設定各種參數
- 因為各種莫名奇妙的原因版號變成 7.17.1 了,
懶得改回 7.17.4...
Reference
- 架構參考至原文傳送門 The Elastic stack (ELK) powered by Docker and Compose. (opens new window)
- Filebeat 官方文件 Filebeat Reference (opens new window)
- Logstash 官方文件 Logstash Reference (opens new window)
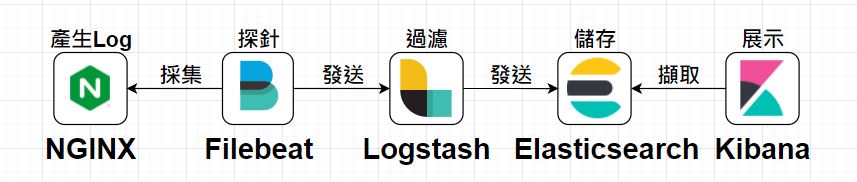
# 服務架構
# Docker Compose 檔案結構
整個 ELK Stack 啟動文件如下,每個服務皆用一個資料夾維護其需要持久化的檔案分別為 elasticsearch;filebeat;kibana;logstash;nginx :
|
├── elasticsearch                       # elasticsearch
│   ├── config                          # elasticsearch 設定文件
│   │   └── elasticsearch.yml
│   ├── data                            # 主要持久化資料的地方
│   └── plugins                         # 預留要掛插件的資料夾
|
├── filebeat                            # filebeat
│   ├── config                          # filebeat 設定文件
│   │   └── filebeat.yml
|   └── modules                         # filebeat modules 設定文件
|       └── nginx.yml
|
├── kibana                              # kibana
│   └── config                          # kibana 設定文件
│       └── kibana.yml
|
├── logstash                            # logstash
│   ├── config                          # logstash 設定文件
│   │   └── logstash.yml
│   └── pipeline                        # logstash pipeline 設定文件
│       └── logstash.conf
|
├── nginx                               # NGINX
│   ├── conf.d                          # 預計放 Config 的地方
│   ├── log                             # nginx log > filebeat 主要會指向這邊並擷取資料
│   |   ├── access.log
│   |   └── error.log
|   └── html                            # 放一些預設的靜態頁面以方便測試
|
└── docker-compose.yml                  # docker-compose up -d 在docker中執行上述所有服務
# Docker Compose 啟動文件
docker compose 啟動文件如下:
- elasticsearch 單節點啟動 映射 9200 port; 9300 給叢集用的暫時沒用到
- kibana 映射 5601 port; 指定
ELASTICSEARCH_HOSTS=http://myelasticsearch01:9200提供資料來源 - logstash 映射 5044 port 供 beat 傳入資料; 9600 port 為外部API用
- nginx 映射 7414 port; 將 log 持久化至磁碟
- filebeat 主要提供服務不映射 port 號;
filebeat -e -strict.perms=false以不檢查檔案的方式啟動; 主要取資料的地方會與 nginx 綁定在同一個空間 - 以下服務全部會啟動再同一個 docker network 中
version: '3.8'
services:
  elasticsearch01:
    image: docker.elastic.co/elasticsearch/elasticsearch:7.17.1
    container_name: myelasticsearch01
    environment:
      - "discovery.type=single-node"
    restart: on-failure
    ports:
      - 9200:9200
      - 9300:9300
    volumes:
      - type: bind
        source: ./elasticsearch/config/elasticsearch.yml
        target: /usr/share/elasticsearch/config/elasticsearch.yml
      - ./elasticsearch/data:/usr/share/elasticsearch/data
      - ./elasticsearch/plugins:/usr/share/elasticsearch/plugins
    networks:
      - elknetwrok

  kibana:
    image: docker.elastic.co/kibana/kibana:7.17.1
    container_name: mykibana
    environment:
      - "ELASTICSEARCH_HOSTS=http://myelasticsearch01:9200"
    ports:
      - 5601:5601
    volumes:
        - type: bind
          source: ./kibana/config/kibana.yml
          target: /usr/share/kibana/config/kibana.yml
    networks:
      - elknetwrok

  logstash:
    image: docker.elastic.co/logstash/logstash:7.17.1
    container_name: mylogstash
    ports:
      - 5044:5044
      - 9600:9600
    volumes:
      - type: bind
        source: ./logstash/config/logstash.yml
        target: /usr/share/logstash/config/logstash.yml
      - type: bind
        source: ./logstash/pipeline/logstash.conf
        target: /usr/share/logstash/pipeline/logstash.conf
    networks:
      - elknetwrok

  nginx:
    image: nginx:latest
    container_name: mynginx
    ports:
      - 7414:80
    volumes:
      - ./nginx/log/nginx:/var/log/nginx
      - ./nginx/html:/usr/share/nginx/html
    networks:
      - elknetwrok

  filebeat:
    image: docker.elastic.co/beats/filebeat:7.17.1
    user: root
    container_name: myfilebeat
    command: filebeat -e -strict.perms=false
    volumes:
      - type: bind
        source: ./filebeat/config/filebeat.yml
        target: /usr/share/filebeat/filebeat.yml
      - ./nginx/log/nginx:/var/log/nginx
    networks:
      - elknetwrok
    depends_on:
      - elasticsearch
      - logstash
      - kibana
      - nginx

networks:
  elknetwrok:
    name: elknetwrok
以 docker-compose up -d 執行YAML檔;執行成功顯示如下:
C:\Users\mobet>docker ps
CONTAINER ID   IMAGE                                                  COMMAND                  CREATED       STATUS             PORTS                                            NAMES
5df7807c57e0   docker.elastic.co/beats/filebeat:7.17.1                "/usr/bin/tini -- /u…"   2 hours ago   Up 2 hours                                                          myfilebeat
debccbfeb4fe   docker.elastic.co/logstash/logstash:7.17.1             "/usr/local/bin/dock…"   2 hours ago   Up About an hour   0.0.0.0:5044->5044/tcp, 0.0.0.0:9600->9600/tcp   mylogstash
646ef2f0ce45   docker.elastic.co/elasticsearch/elasticsearch:7.17.1   "/bin/tini -- /usr/l…"   2 hours ago   Up 2 hours         0.0.0.0:9200->9200/tcp, 0.0.0.0:9300->9300/tcp   myelasticsearch01
0d6d08fd3761   nginx:latest                                           "/docker-entrypoint.…"   2 hours ago   Up 2 hours         0.0.0.0:7414->80/tcp                             mynginx
4c101a1f203f   docker.elastic.co/kibana/kibana:7.17.1                 "/bin/tini -- /usr/l…"   2 hours ago   Up 2 hours         0.0.0.0:5601->5601/tcp                           mykibana
# 重要的 Config
ELK Stack 作為開箱即用的服務有大量的 Config 可以配置,簡單紀錄一下兩個設定比較神秘的 config :
# filebeat.yml
主要描述 filebeat 該如何採集資料與採集甚麼資料
- filebeat.modules : filebeat中有許多內置的模組藉由編寫設定便可以輕鬆採集資料這裡使用 NGINX module
- filebeat.modules.access.var.paths 中的路徑便採集對象所在的資料夾
- output : 指定 filebeat 採集後的資料要發送到哪邊
- 官方模組列表 https://www.elastic.co/guide/en/beats/filebeat/current/filebeat-modules.html (opens new window)
- filebeat 是以 GO 語言開發的服務;本身理解其特性較為面向 "client" 端
# ============================== Filebeat modules ==============================

filebeat.config:
  modules:
    path: ${path.config}/modules.d/*.yml
    reload.enabled: false

filebeat.modules:
- module: nginx
  access:
    enabled: true
    var.paths: ['/var/log/nginx']
  error:
    enabled: false
    var.paths: ["/var/log/nginx/error.log"]

# ======================= Elasticsearch template setting =======================

setup.template.settings:
  index.number_of_shards: 1
  #index.codec: best_compression
  #_source.enabled: false

# ================================== Outputs ===================================

# Configure what output to use when sending the data collected by the beat.

# output.elasticsearch:
#   hosts: ["http://myelasticsearch01:9200/"]

output.logstash:
  hosts: ["mylogstash:5044"]
# logstash.conf
主要描述想透過 logstash 輸入、過濾、輸出甚麼資料:
- 分為三個區塊分別為 input;filter;output
- input : 設定資料來源;這裡為接收 beats 傳送過來的資料
- filter : 針對來源資料做清洗與解析
- output : 將資料轉送至何處持久化;這裡為轉送至 elasticsearch 並以 mybeat-%{+YYYY.MM.dd} 作為 index 儲存
- filter 內容來源至官方 NGINX 範例加以改寫; 範例來源官方連結 (opens new window)
- logstash 是以 JAVA 語言開發的服務;本身理解其特性較為面向 "server" 端
input {
  beats {
    port => 5044
  }
}
filter {
  if [event][module] == "nginx" {
    if [fileset][name] == "ingress_controller" {
      grok {
        match => { "message" => ["%{IPORHOST:[nginx][access][remote_ip]} - %{DATA:[nginx][access][user_name]|-} \[%{HTTPDATE:[nginx][access][time]}\] \"%{WORD:[nginx][access][method]} %{DATA:[nginx][access][url]} HTTP/%{NUMBER:[nginx][access][http_version]}\" %{NUMBER:[nginx][access][response_code]} %{NUMBER:[nginx][access][body_sent][bytes]} \"%{DATA:[nginx][access][referrer]}\" \"%{DATA:[nginx][access][agent]}\""] }
        remove_field => "message"
      }
      mutate {
        add_field => { "read_timestamp" => "%{@timestamp}" }
      }
      date {
        match => [ "[nginx][access][time]", "dd/MMM/YYYY:H:m:s Z" ]
        remove_field => "[nginx][access][time]"
      }
      useragent {
        source => "[nginx][access][agent]"
        target => "[nginx][access][user_agent]"
        remove_field => "[nginx][access][agent]"
      }
      geoip {
        source => "[nginx][access][remote_ip]"
        target => "[nginx][access][geoip]"
      }
    }
  }
}
output {
  elasticsearch  {
    hosts => "myelasticsearch01:9200"
    index => "mybeat-%{+YYYY.MM.dd}"
  }
}
# 基本使用
# 排雷大隊
記憶體很重要
docker 中請用
command: filebeat -e -strict.perms=false啟動filebeat,不要用 entrypoint ; entrypoint 會再幫你啟動一次 beat 一次會丟兩筆資料...一時不察偵錯很久。command 與 entrypoint 的差異一個覆蓋指令;一個是追加指令如果有幸把 docker 的筆記整理過來再附上比較連結如果 Logstash 出現
Could not index event to Elasticsearch這個錯誤[2022-06-27T12:28:40,210][ERROR][logstash.outputs.elasticsearch][main][63c7cebabda6b571b9b01c302e26faff25c0e5dc84e5e82df9e9a79abd46f857] Could not index event to Elasticsearch. {:status=>400, :action=>["index", {:_id=>nil, :_index=>"%{[Mybeat]}-2022.06.27", :routing=>nil}, {"fileset"=>{"name"=>"ingress_controller"}, "input"=>{"type"=>"log"}, "event"=>{"timezone"=>"+00:00", "dataset"=>"nginx.ingress_controller", "module"=>"nginx"}, "tags"=>["beats_input_codec_plain_applied"], "host"=>{"hostname"=>"876652f136f8", "ip"=>["172.21.0.5"], "mac"=>["02:42:ac:15:00:05"], "os"=>{"kernel"=>"5.10.16.3-microsoft-standard-WSL2", "platform"=>"ubuntu", "family"=>"debian", "codename"=>"focal", "version"=>"20.04.3 LTS (Focal Fossa)", "name"=>"Ubuntu", "type"=>"linux"}, "name"=>"876652f136f8", "containerized"=>true, "architecture"=>"x86_64"}, "agent"=>{"ephemeral_id"=>"777ba821-b649-46e2-9ee1-a409193c5545", "hostname"=>"876652f136f8", "id"=>"7f7c2a40-d0d9-461e-a9a1-96dced9967fd", "version"=>"7.17.1", "name"=>"876652f136f8", "type"=>"filebeat"}, "ecs"=>{"version"=>"1.12.0"}, "service"=>{"type"=>"nginx"}, "@timestamp"=>2022-06-27T12:28:37.268Z, "message"=>"172.21.0.1 - - [27/Jun/2022:12:28:33 +0000] \"GET /helloworld01.html HTTP/1.1\" 200 21 \"-\" \"Mozilla/5.0 (Windows NT 10.0; Win64; x64) AppleWebKit/537.36 (KHTML, like Gecko) Chrome/102.0.0.0 Safari/537.36\" \"-\"", "@version"=>"1", "log"=>{"offset"=>1204, "file"=>{"path"=>"/var/log/nginx/access.log"}}}], :response=>{"index"=>{"_index"=>"%{[Mybeat]}-2022.06.27", "_type"=>"_doc", "_id"=>nil, "status"=>400, "error"=>{"type"=>"invalid_index_name_exception", "reason"=>"Invalid index name [%{[Mybeat]}-2022.06.27], must be lowercase", "index_uuid"=>"_na_", "index"=>"%{[Mybeat]}-2022.06.27"}}}}看一下 Reason 通常會提示你
Invalid index name [%{[Mybeat]}-2022.06.27], must be lowercase"這邊就是說 Index 不能是大寫...出現 config file ("filebeat.yml") can only be writable
config file ("filebeat.yml") can only be writable by the owner but the permissions are "-rwxrwxrwx" (to fix the permissions use: 'chmod go-w /usr/share/filebeat/filebeat.yml')先讓
filebeat -e -strict.perms=falsefilebeat -h這個指令很好用...