# Beats Introduction
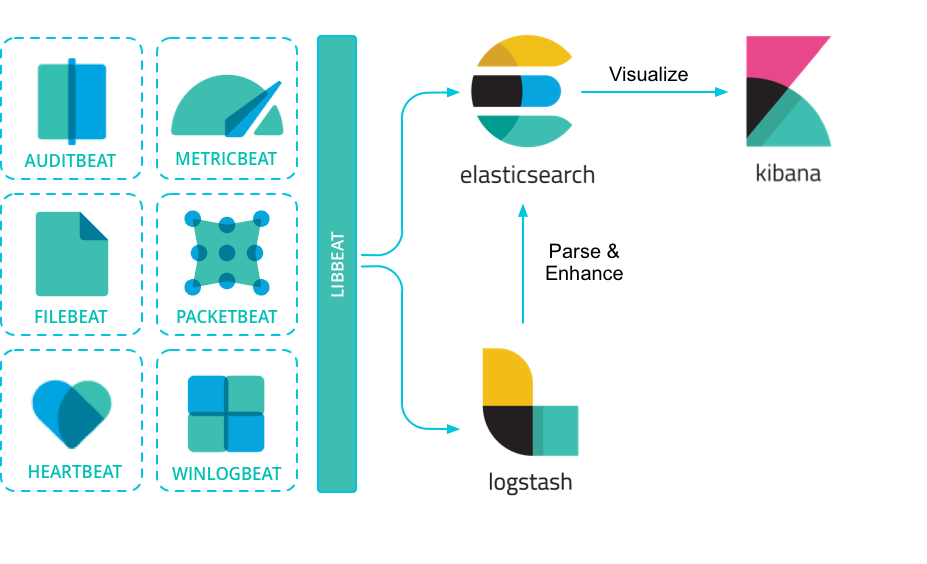
Beats is a free and open platform for single-purpose data shippers. They send data from hundreds or thousands of machines and systems to Logstash or Elasticsearch.
Beats 為 Elastic Stack 中的一員,在其中主要負責資料採集與資料推送;Beats 是一個以GO語言開發的開源(Open source)應用,作為一個輕量級的應用 Beats 能輕鬆採集系統中的各項資料,並將資料傳送至 Logstash 或 Elasticsearch 上
- Open source data shippers 開源的資料採集
- Libbeat Base 基於 Libbeat framework 以GO語言開發,具輕量的特性
- Beats can send data directly to Elasticsearch or via Logstas 將採集的資料送到 Elasticsearch 或 Logstas
📘 Reference
# The Beats
Beats 官方頁面可以看到有許多種類的 Beat,這些 Beat 分別針對不同的環境與不同的數據進行採集,以下為基本的使用情境
目前在 Elastic 官方頁面可以看到這幾個 Beats 提供開發人員使用,以下簡介一下各種 Beat 的使用環境
# Filebeat
![]()
Whether you’re collecting from security devices, cloud, containers, hosts, or OT,
Filebeat helps you keep the simple things simple by offering a lightweight way to forward and centralize logs and files.
Filebeat 用於採集各式文件,只要是以文件形式存在的檔案都可以用 Filebeat 來進行採集,應該是最常使用的 Beats 之一,
舉例來說作為應用日誌通常檔案都是 xxx.log,使用 Filebeat 便能輕鬆得將這些 Log 傳送至指定的地方,提供查詢與分析
# Metricbeat
![]()
Collect metrics from your systems and services. From CPU to memory, Redis to NGINX, and much more,
Metricbeat is a lightweight way to send system and service statistics.
Metricbeat 用於採集各"指標"資料,這些指標可以是系統的 CPU ; 記憶體 ; 或硬碟空間.....等等系統資訊,
也可以是某些應用的資本資訊例如: MSSQL 現在的連線數 ; Redis 目前的記憶體用量
# Heartbeat
![]()
Monitor services for their availability with active probing.
Given a list of URLs, Heartbeat asks the simple question: Are you alive?
Heartbeat ships this information and response time to the rest of the Elastic Stack for further analysis.
Heartbeat 用於採集系統中的各項應用是否正常運作,Heartbeat 或透過設定好的 URL,定期採集這些暴露出來的 URL 是否成功回應用以確定應用是否還 "活著"
※ 補充 Heartbeat 與 Metricbeat
- Heartbeat : 相當於管生死,以生物來說就是還有沒有生命跡象;以系統來說,監控這個服務或應用是否還是正常運作
- Metricbeat : 相當於管狀態,以生物來說就是血壓、心跳數、體脂肪;以系統來說就是 CPU、記憶體、硬碟空間...等等
# Packetbeat
![]()
Monitoring your network traffic is critical to gaining observability and securing your environment — ensuring high levels of performance and security.
Packetbeat is a lightweight network packet analyzer that sends data from your hosts and containers to Logstash or Elasticsearch.
Packetbeat 用於採集系統的網路流量,
以 Http 協議為例子,Packetbeat 可以追蹤應用中 HTTP 協議的延遲或錯誤、回應時間、追蹤使用者鏈路...等等
# Winlogbeat
![]()
Keep a pulse on what's happening across your Windows-based infrastructure. Stream Windows event logs to Elasticsearch and Logstash with Winlogbeat.
Winlogbeat 用於採集 Windows 中的各項事件日誌,Winlogbeat 僅僅服務於 Windows 中,
Winlogbeat 針對 Windows 事件檢視器中資料採集,例如在事件檢視器中 "Windows 記錄" 下的應用程式、安全性、系統......等等的資料
# Auditbeat
![]()
Collect your Linux audit framework data and monitor the integrity of your files.
Auditbeat ships these events in real time to the rest of the Elastic Stack for further analysis.
Auditbeat 用於採集 Linux audit data 或文件變更資料,應該是類似偵測資料夾或文件權限變更的東西,這個我不怎麼熟有空再看看......
# Functionbeat
![]()
Deploy as a function in your cloud provider’s Function-as-a-Service (FaaS) platform to collect, ship, and monitor data from your cloud services.
Functionbeat 用於採集 cloud services 的相關資料,不過現在的我無可奉告......
# Other
假設上面的 Beats 都不符合需求的話其實也可以擴展自己的 Beat,每個 Beat 皆是以 libbeat 這個 Lib 為基礎來開發,所以真的需要高度客製化也是可以自製自己的 Beats,list of community Beats (opens new window) 此處收錄一些 Beats 擴展的相關討論社群